Logging
Runway application logs are available in Grafana via ClickHouse. This guide explains how to access, query, and filter logs for your Runway services.
How Logging Works
Section titled “How Logging Works”Runway collects logs from both Cloud Run and Kubernetes (EKS and GKE) workloads using OpenTelemetry. For Kubernetes the setup looks like:
┌─────────────────────┐│ Your Application ││ (stdout/stderr) │└──────────┬──────────┘ │ ▼┌─────────────────────┐│ OpenTelemetry ││ Agent Collector ││ │└──────────┬──────────┘ │ Adds K8s metadata, severity, etc │ ▼┌─────────────────────┐│ OpenTelemetry ││ Gateway Collector │└──────────┬──────────┘ │ ▼┌─────────────────────┐│ Google Cloud ││ Pub/Sub │└──────────┬──────────┘ │ ▼┌─────────────────────┐│ ClickHouse ││ (observability DB) │└──────────┬──────────┘ │ ▼┌────────────────────────────────────┐│ Grafana - ClickHouse Data Source ││ dashboards.gitlab.net │└────────────────────────────────────┘The OpenTelemetry collectors automatically:
- Collect container logs from all Runway workloads
- Parse JSON-formatted logs and extract fields into log attributes
- Add Kubernetes metadata (pod name, namespace, deployment)
- Infer log severity and add it as a label
- Add cluster and environment context to the logs
For Cloud Run, the setup is simpler. The logs are automatically gathered by GCP observability, and then are routed to a Pub/Sub queue using a GCP log sink.
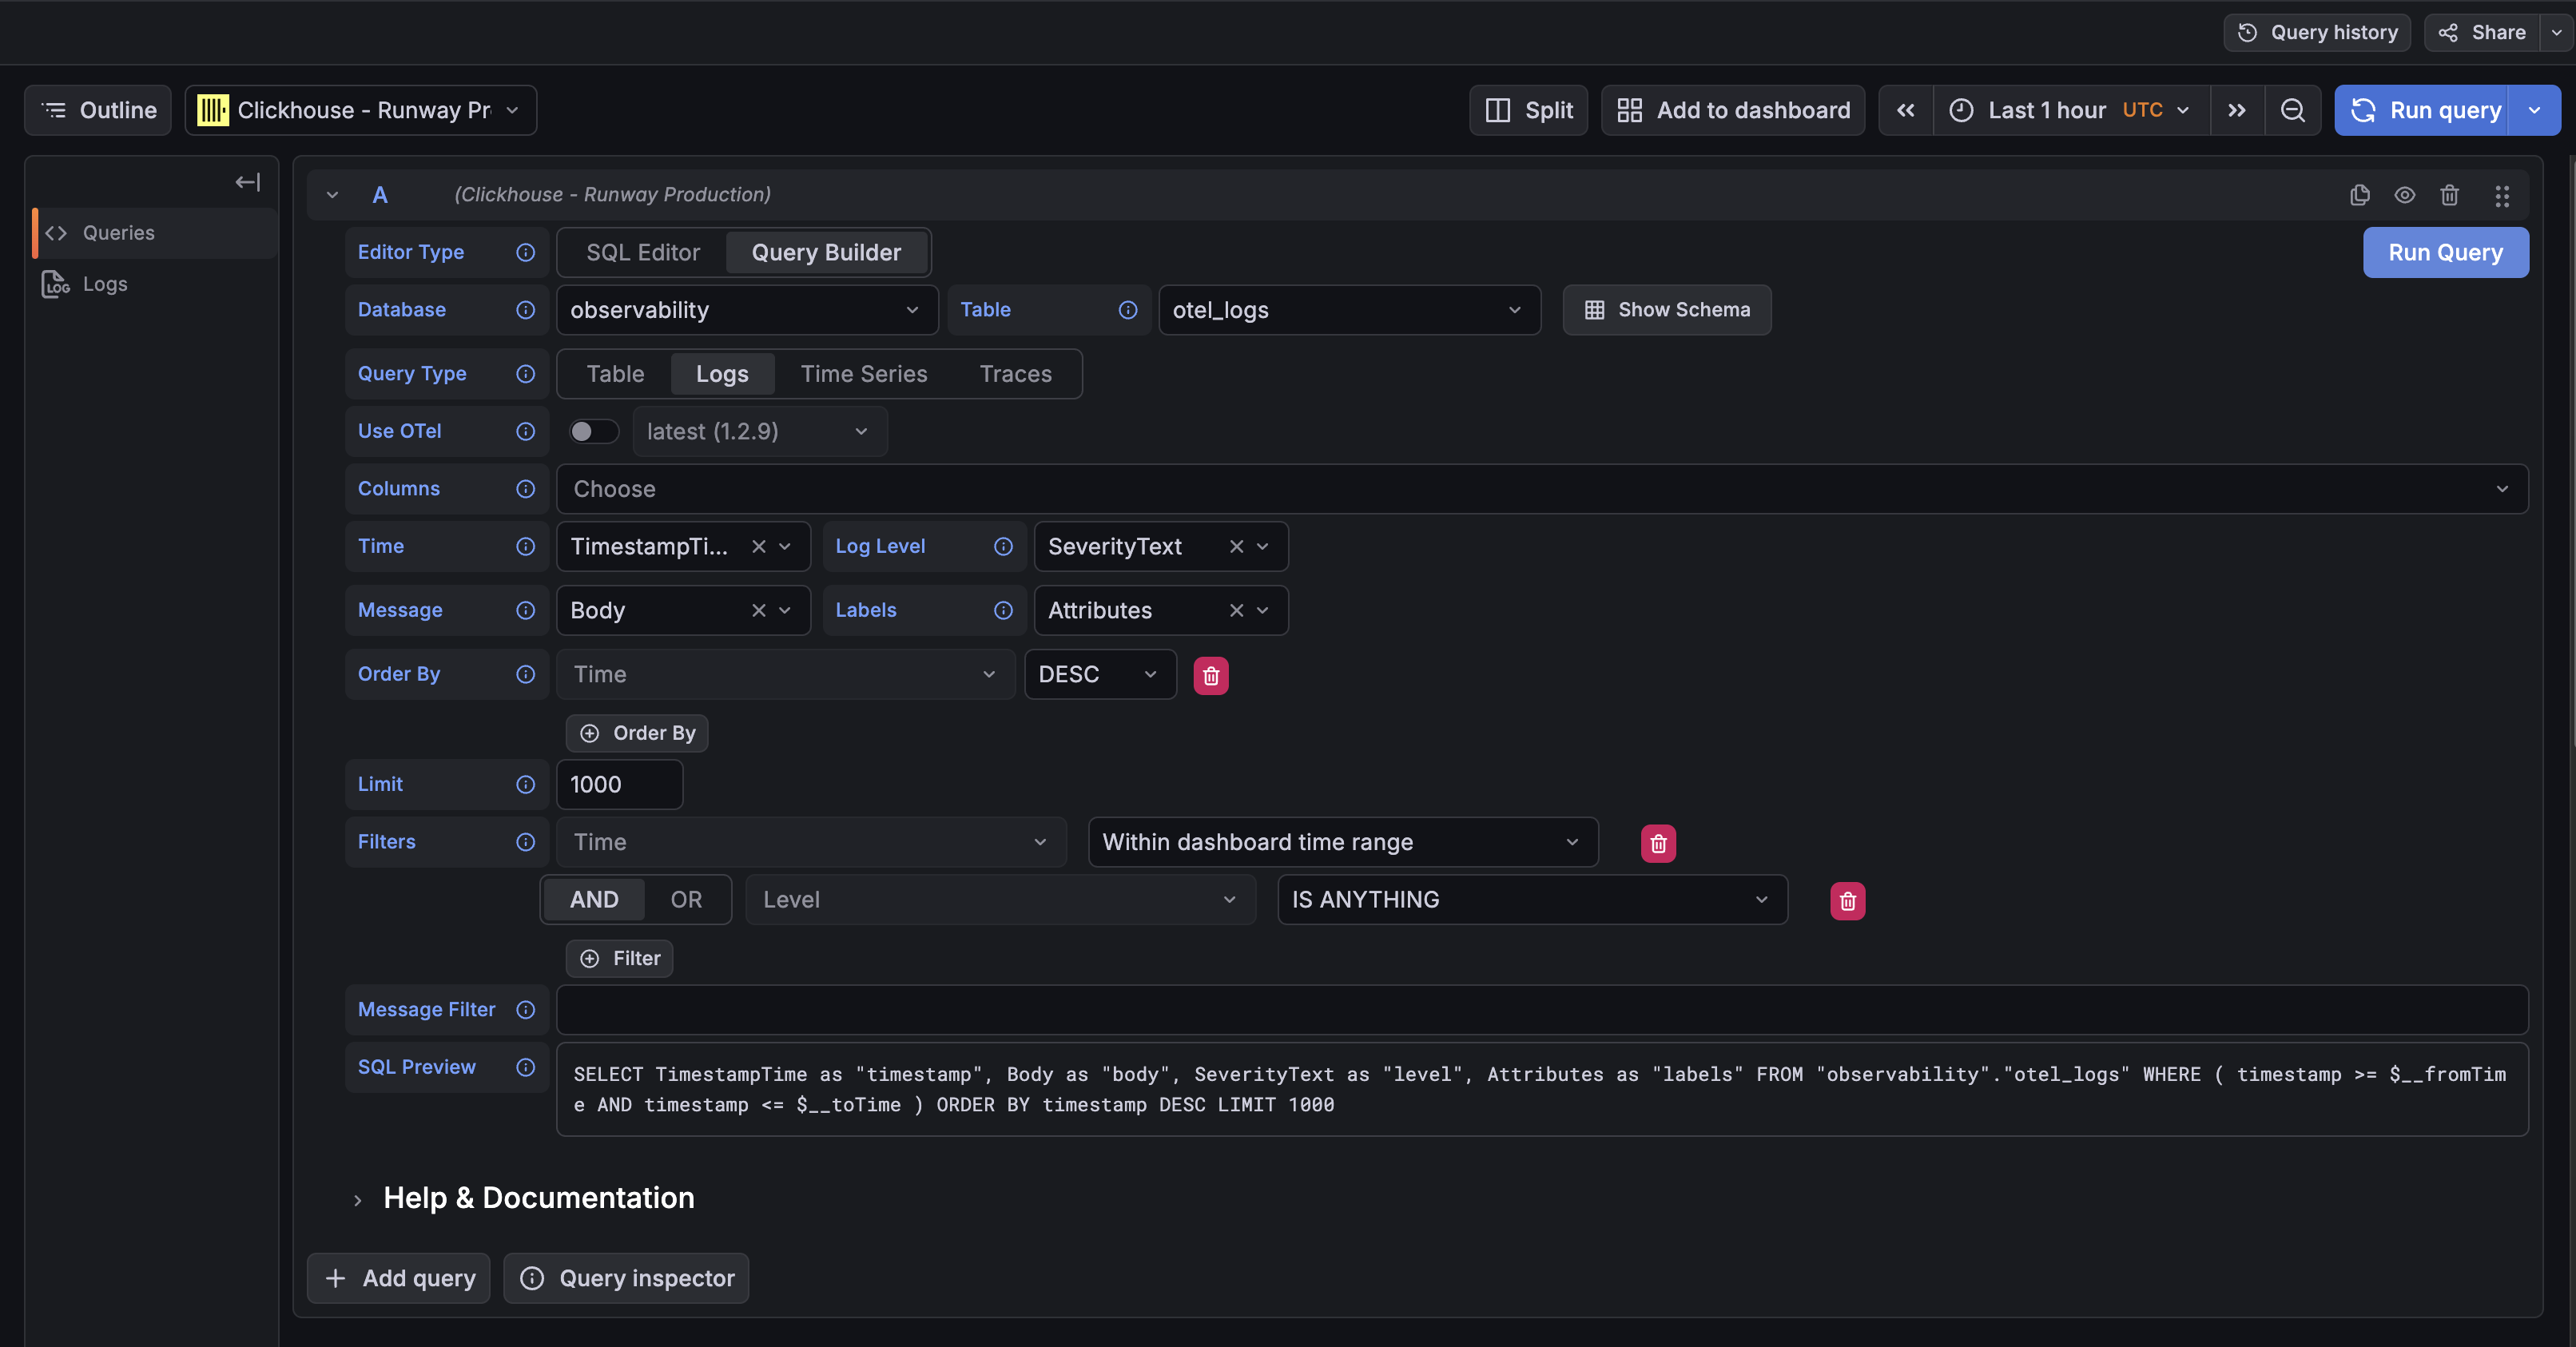
Accessing Logs
Section titled “Accessing Logs”Logs are accessible through Grafana’s Explore interface:
- Go to Grafana Explore
- Select the ClickHouse - Runway Production datasource
- Choose the
observabilitytable - Choose
logsas the query type - Add filters for your service
Direct link: Grafana Explore with ClickHouse
Log Schema
Section titled “Log Schema”Runway logs are stored in the observability.otel_logs table with the following key fields:
| Field | Description | Example |
|---|---|---|
TimestampTime | Log timestamp | 2026-02-13T19:47:30.047238Z |
ServiceName | Runway service ID | my-service-cloudrun |
SeverityText | Log level | info, error, warn |
Body | Log message content | {Request completed successfully} |
Attributes[cloud.runtime] | Runtime of the service (gcp_cloud_run, gke or eks) | gcp_cloud_run |
Attributes[cloud.provider] | Cloud provider for the service (gcp or aws) | gcp |
Attributes[cloud.region] | Region of the service | us-east1 |
Kubernetes Specific Attributes
Section titled “Kubernetes Specific Attributes”For Kubernetes workloads (EKS and GKE), additional metadata is automatically added:
| Attribute | Description | Example |
|---|---|---|
k8s.cluster.name | Cluster name | runway-eks-prd-us-east-1 |
k8s.container.name | Container name | app |
k8s.container.restart_count | Container restart count | 0 |
k8s.deployment.name | Deployment name | glgo-eks |
k8s.namespace.name | Namespace | glgo-eks |
k8s.node.name | Node name/ID | i-0d7404c91b2247fa0 |
k8s.pod.name | Pod name | glgo-eks-9849f4bb9-lx5p6 |
k8s.pod.start_time | Pod start timestamp | 2026-02-13T17:51:41Z |
k8s.pod.uid | Pod unique identifier | 98d3c9d8-0d01-4b1d-b392-221143422444 |
Querying Logs
Section titled “Querying Logs”Basic Query Structure
Section titled “Basic Query Structure”SELECT TimestampTime, SeverityText, Body, AttributesFROM observability.otel_logsWHERE ServiceName = 'duo-workflow-svc-eks-production' AND TimestampTime >= now() - INTERVAL 1 HOURORDER BY TimestampTime DESCLIMIT 100Filter by Environment
Section titled “Filter by Environment”Cloud Run Workloads
Section titled “Cloud Run Workloads”Production:
WHERE Attributes['gcp.project_id'] = 'gitlab-runway-production'Staging:
WHERE Attributes['gcp.project_id'] = 'gitlab-runway-staging'Kubernetes Workloads
Section titled “Kubernetes Workloads”Production:
WHERE Attributes['env'] = 'production'Staging:
WHERE Attributes['env'] = 'staging'Filter by Log Level
Section titled “Filter by Log Level”WHERE SeverityText = 'error'Search Log Content
Section titled “Search Log Content”WHERE Body LIKE '%error%'Search by Runtime and Cloud Provider
Section titled “Search by Runtime and Cloud Provider”WHERE Attributes['cloud.provider'] = 'gcp' AND Attributes['cloud.runtime'] = 'gcp_cloud_run'Examples
Section titled “Examples”Recent Errors for a Service
Section titled “Recent Errors for a Service”SELECT TimestampTime, SeverityText, Body, Attributes['correlation_id'] as correlation_idFROM observability.otel_logsWHERE ServiceName = 'my-service-cloudrun' AND SeverityText = 'error' AND Attributes['gcp.project_id'] = 'gitlab-runway-production' AND TimestampTime >= $__fromTime AND TimestampTime <= $__toTimeORDER BY TimestampTime DESCLIMIT 100Trace a Request by Correlation ID
Section titled “Trace a Request by Correlation ID”SELECT TimestampTime, SeverityText, BodyFROM observability.otel_logsWHERE Attributes['correlation_id'] = 'your-correlation-id' AND TimestampTime >= now() - INTERVAL 1 DAYORDER BY TimestampTime ASCStructured Logging Best Practices
Section titled “Structured Logging Best Practices”To get the most out of the logging pipeline, it is suggested to use Labkit Logging. You can find more info here.
Benefits of structured logging:
- Fields are automatically extracted into
Attributes - Enables filtering and aggregation on fields
- Severity is extracted from
level,severity, or similar fields
Support
Section titled “Support”For questions about logging infrastructure, contact the Observability team in #g_observability.
For Runway-specific logging issues, contact the Runway team in #f_runway.